In ACP 3 we have the main screen or Dashboard that allows us to observe a series of status of invoices from 2 sources and represented in 4 graphs.
In the Portal status we can see (at the top) the Volume of Registered Invoices and Volume of Paid Invoices.
The first graph that is shown is the Volume of Registered Invoices, in this we can see the number of valid and invalid invoices that have been registered according to the time scale.
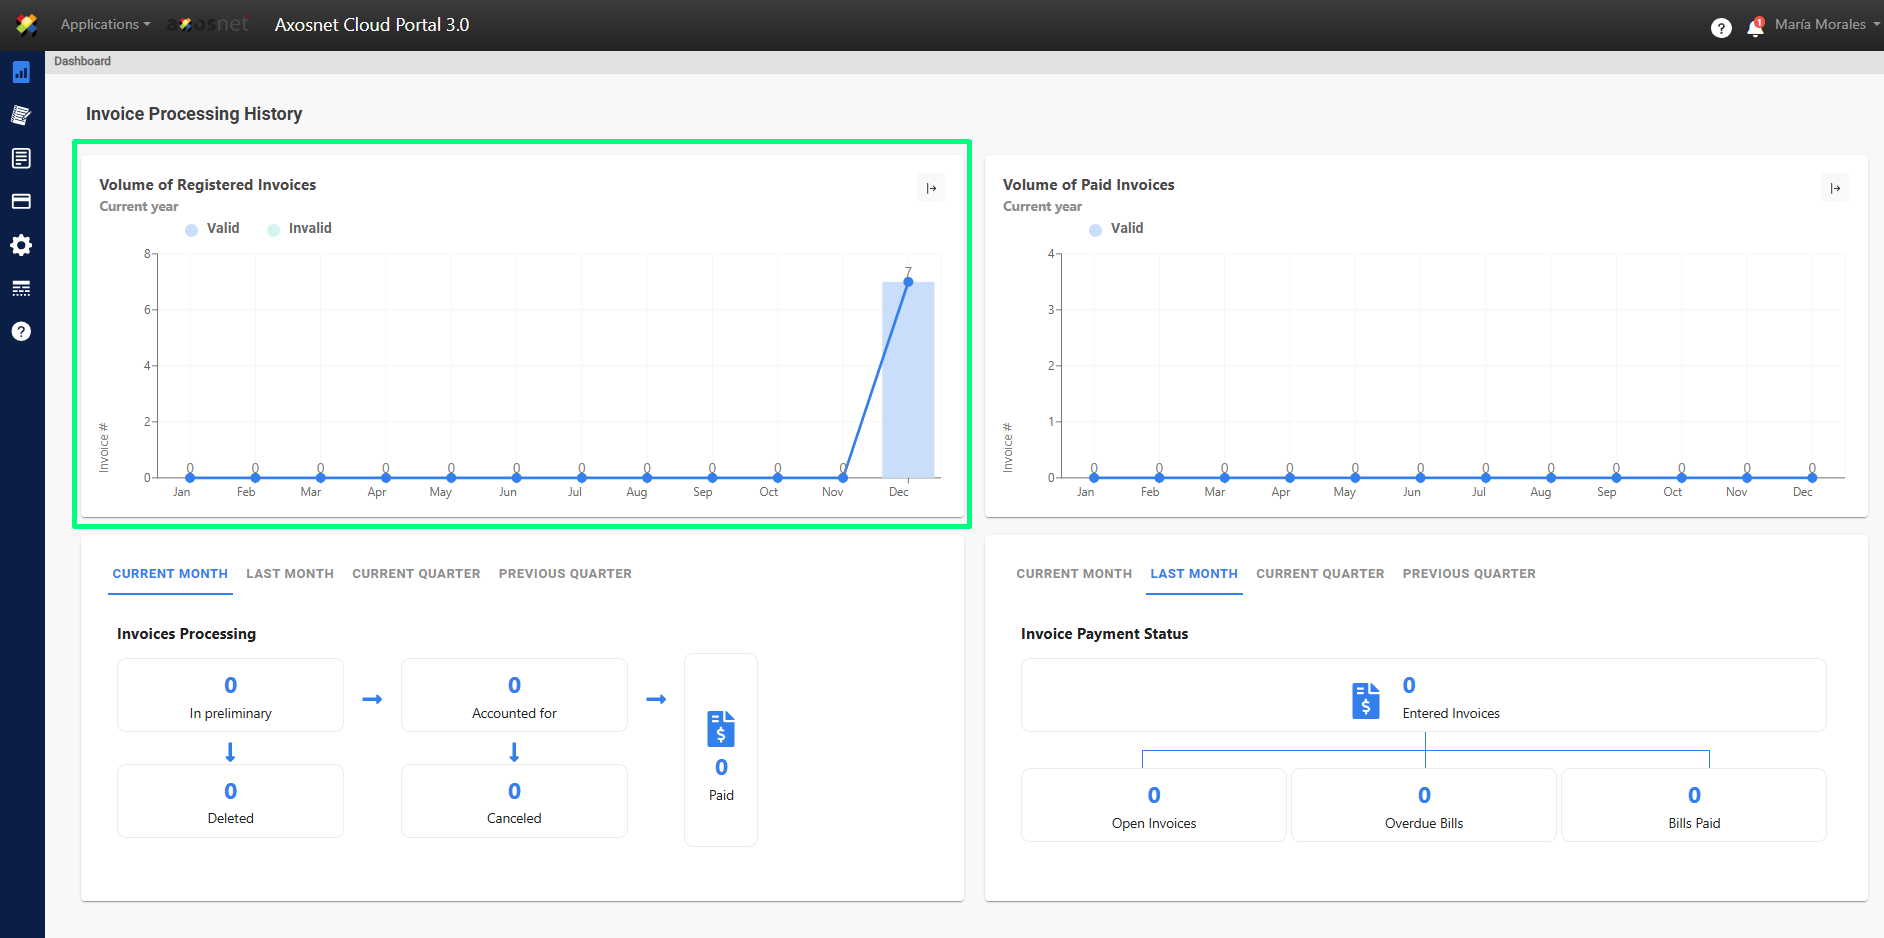
Note: The graph can be expanded if we click on the icon with the arrow at the top right of the graph.