This section shows the statistics of the team “Recognized”, “Use of rewards” and “Recognition between areas” so that the leader can keep track of the collaborators.
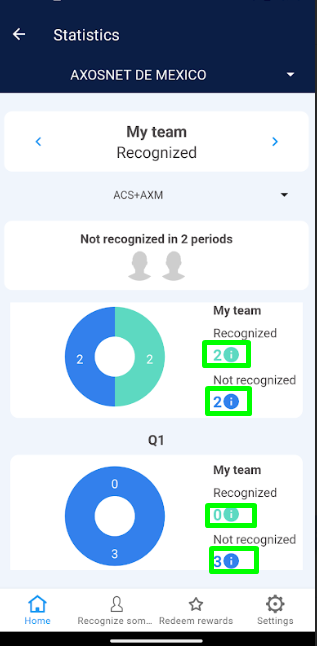
 2. The “Recognized” section is displayed by default in the horizontal menu, check that it is selected.
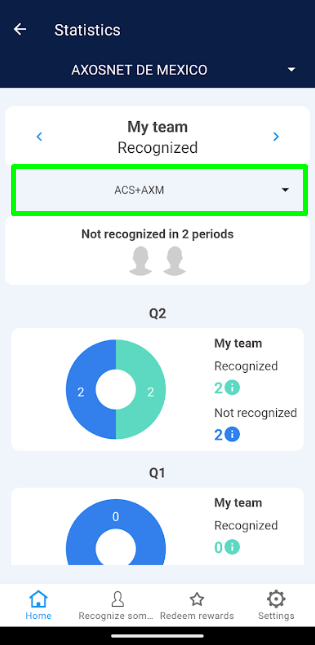
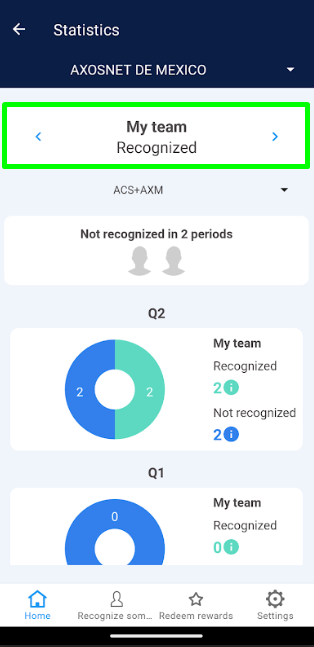 Note: If the user is the leader of 2 or more teams, the leader can select the corresponding team from the menu shown at the top.
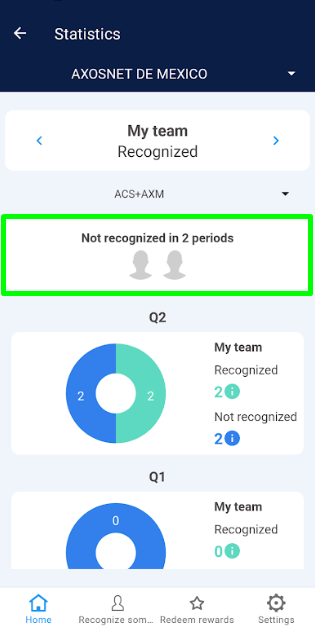
 3. In the “Recognized” section you can identify the following elements:
a) Unrecognized users in two periods: Select the avatar of any user to see the details of each one.
3. In the “Recognized” section you can identify the following elements:
a) Unrecognized users in two periods: Select the avatar of any user to see the details of each one.
 b) Two-period graphs: These graphs show the number of employees who have been active in two periods (quarters), whether recognized or unrecognized.
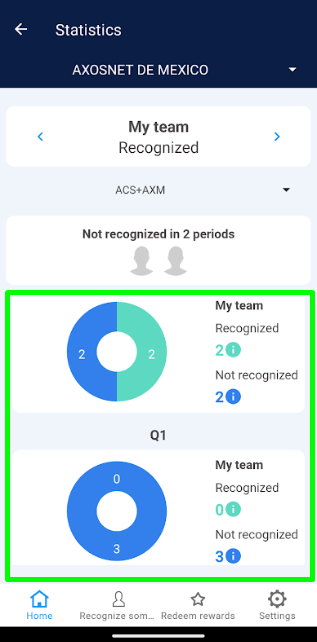 c) List of users: Through the icon (i) you will be able to see the name of the users that are part of the chart as recognized or unrecognized.
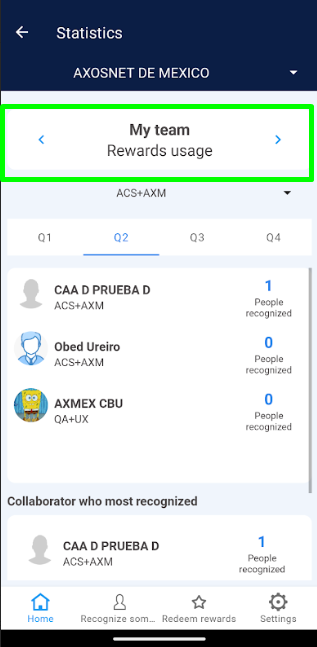
 2. In the horizontal menu select the “Use of Rewards” section.
 Nota: If the user is the leader of 2 or more teams, the leader can select the corresponding team from the menu shown at the top.
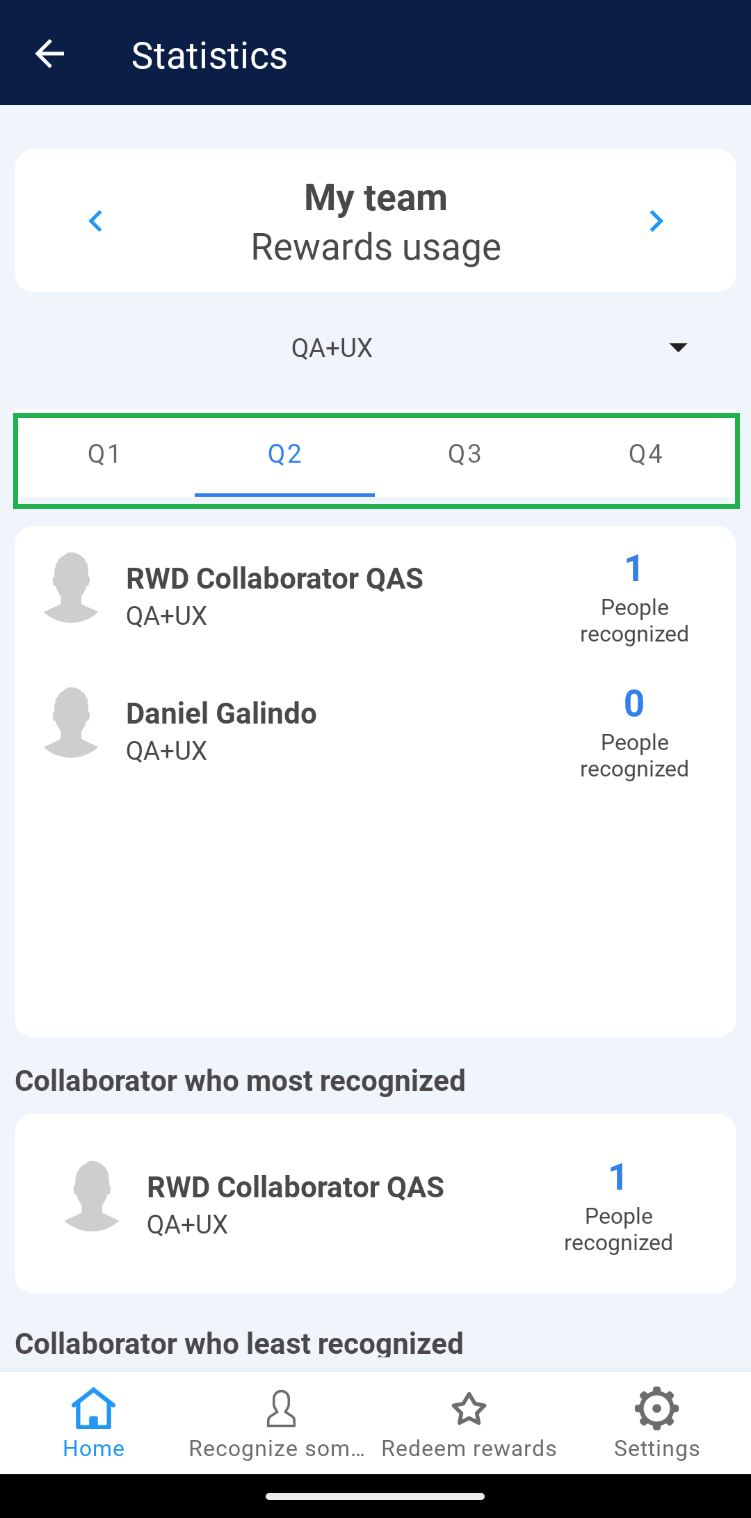
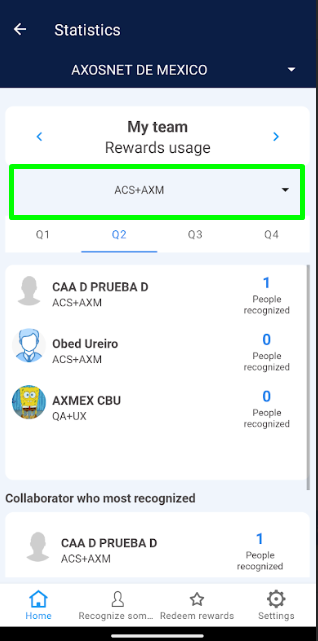 3. In the ” Use of Rewards” section in the horizontal menu, select the period (Q1, Q2, Q3, Q4) you wish to see, where you will be able to identify the following elements:
a) Periods: These are 3-month groupings that show the list of employees (and their team) and the number of people recognized.
b) Team member who received the most recognitions: Highlights the team member who received the most recognitions in that period.
3. In the ” Use of Rewards” section in the horizontal menu, select the period (Q1, Q2, Q3, Q4) you wish to see, where you will be able to identify the following elements:
a) Periods: These are 3-month groupings that show the list of employees (and their team) and the number of people recognized.
b) Team member who received the most recognitions: Highlights the team member who received the most recognitions in that period.
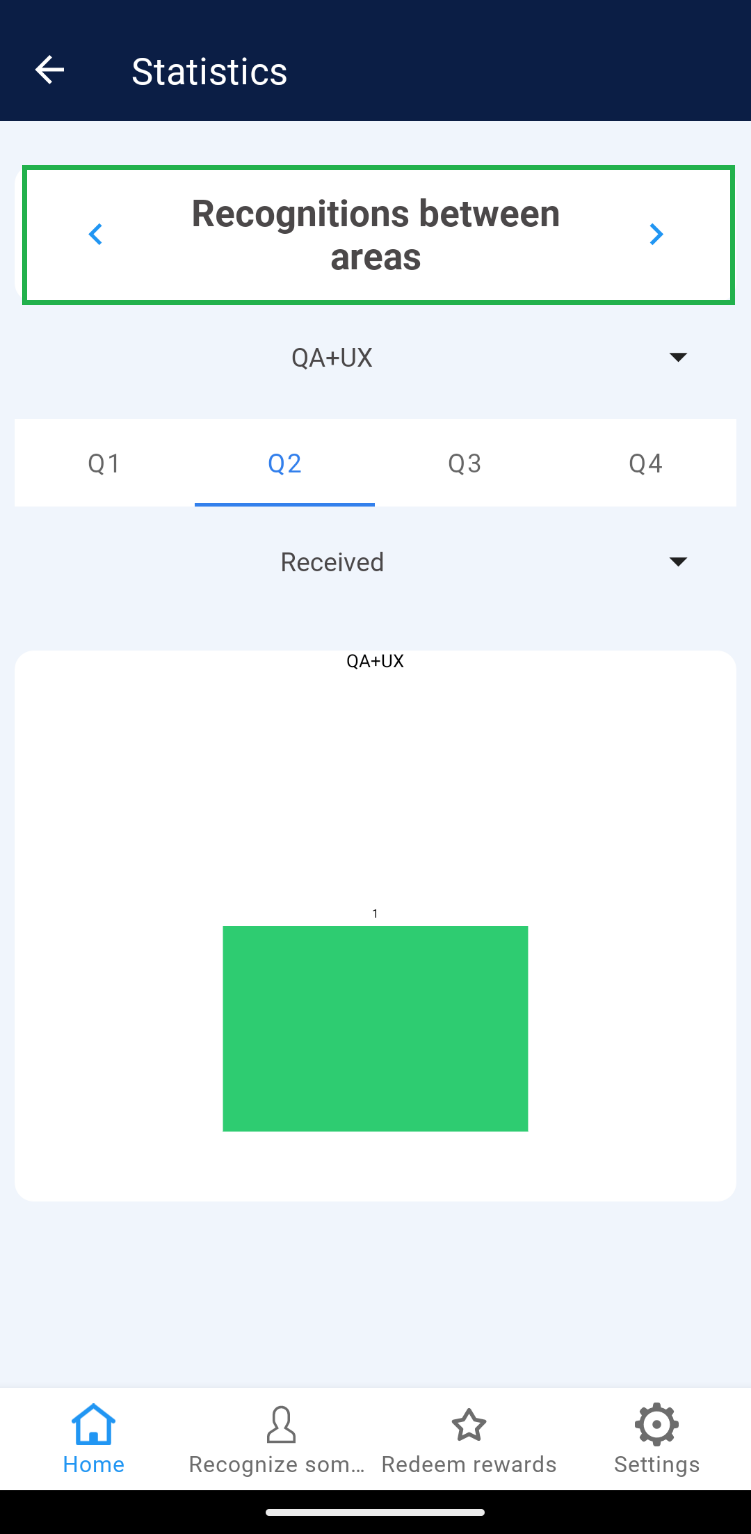
 2. In the horizontal menu select the section “Recognition between areas”.
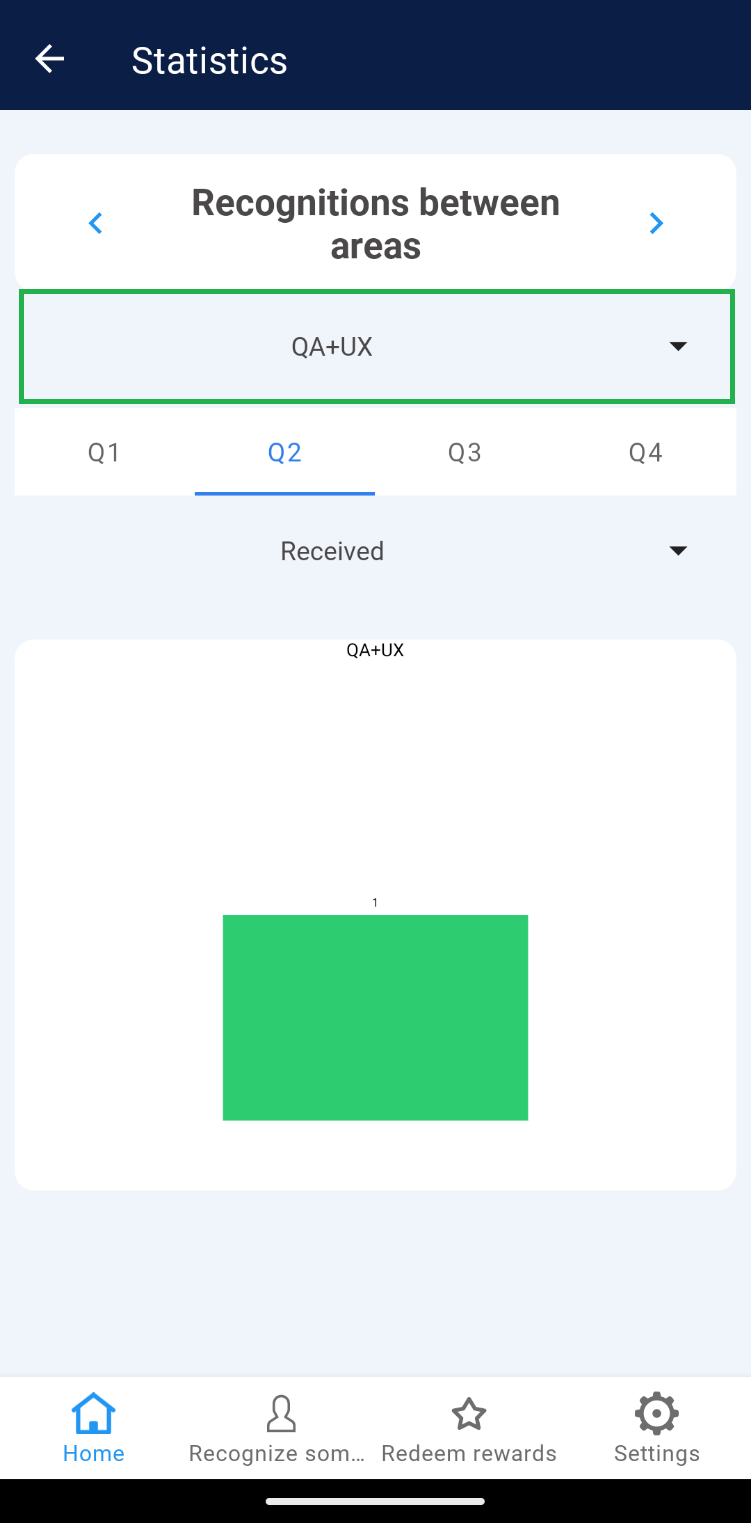
 Nota: If the user is the leader of 2 or more teams, the leader can select the corresponding team from the menu shown at the top.
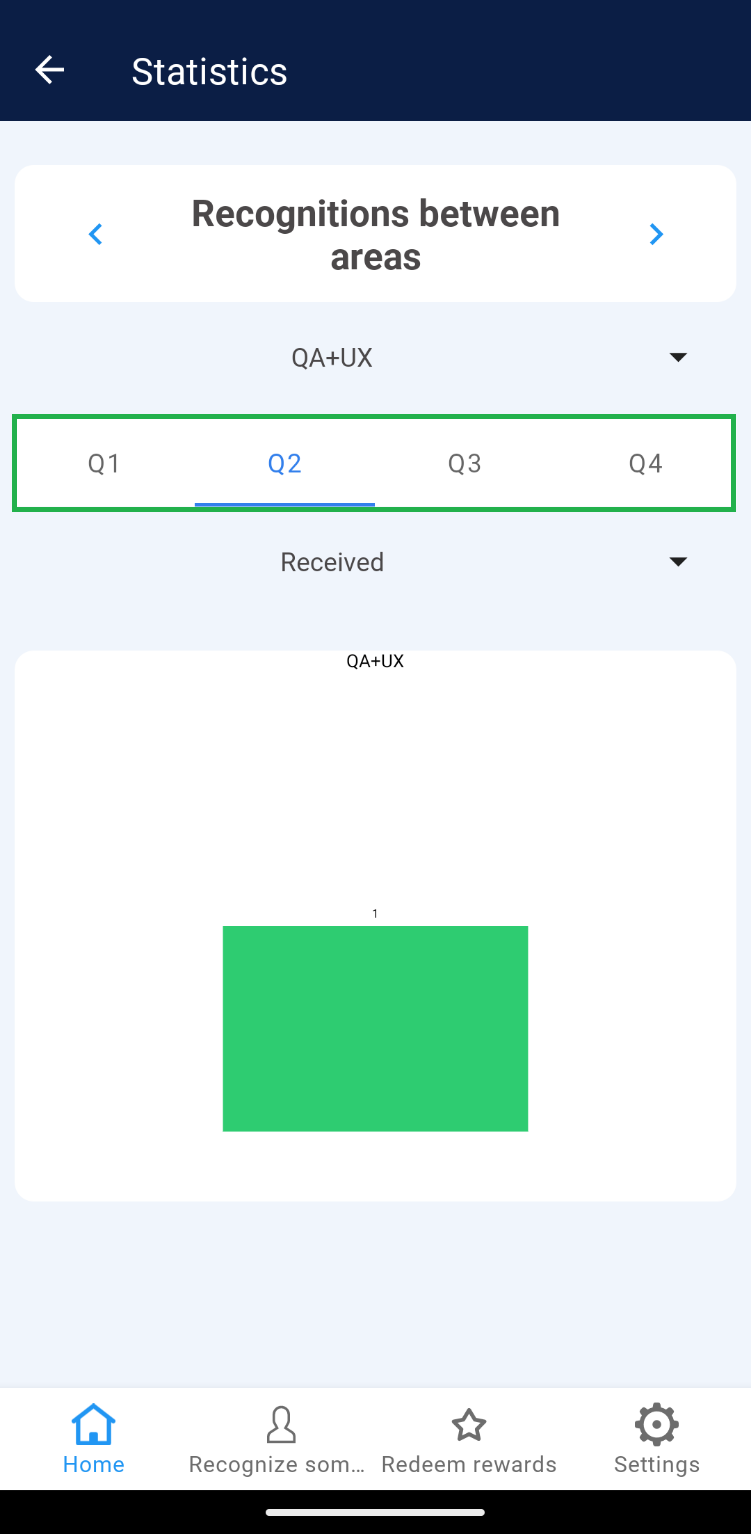
 3. In the “Recognition between areas” section in the horizontal menu, select the period (Q1, Q2, Q3, Q4) you wish to see, where you will be able to identify the following elements:
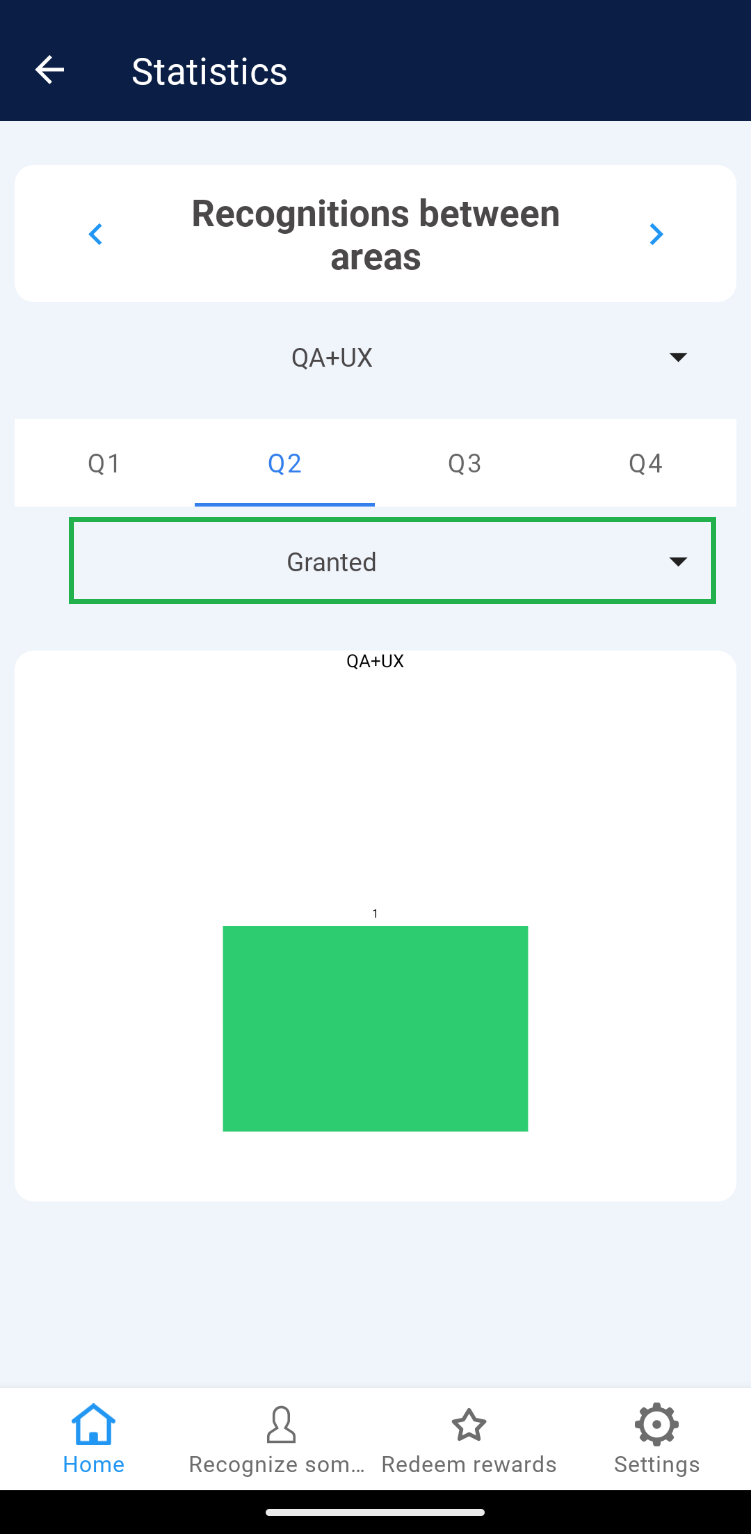
 a) Received: Shows a graph with the recognitions received by other teams.
 b)Awarded: Shows a graph with the recognitions given to other teams.
Recognized
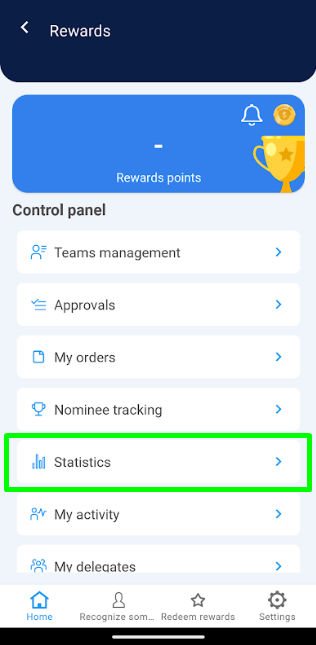
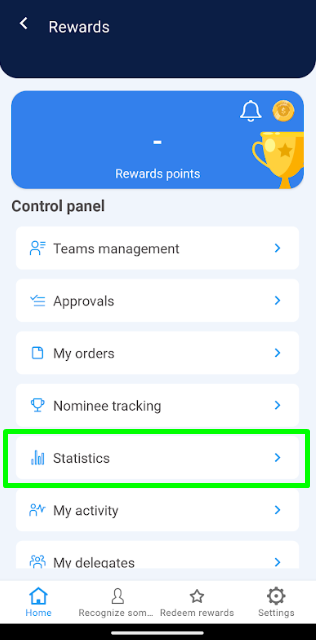
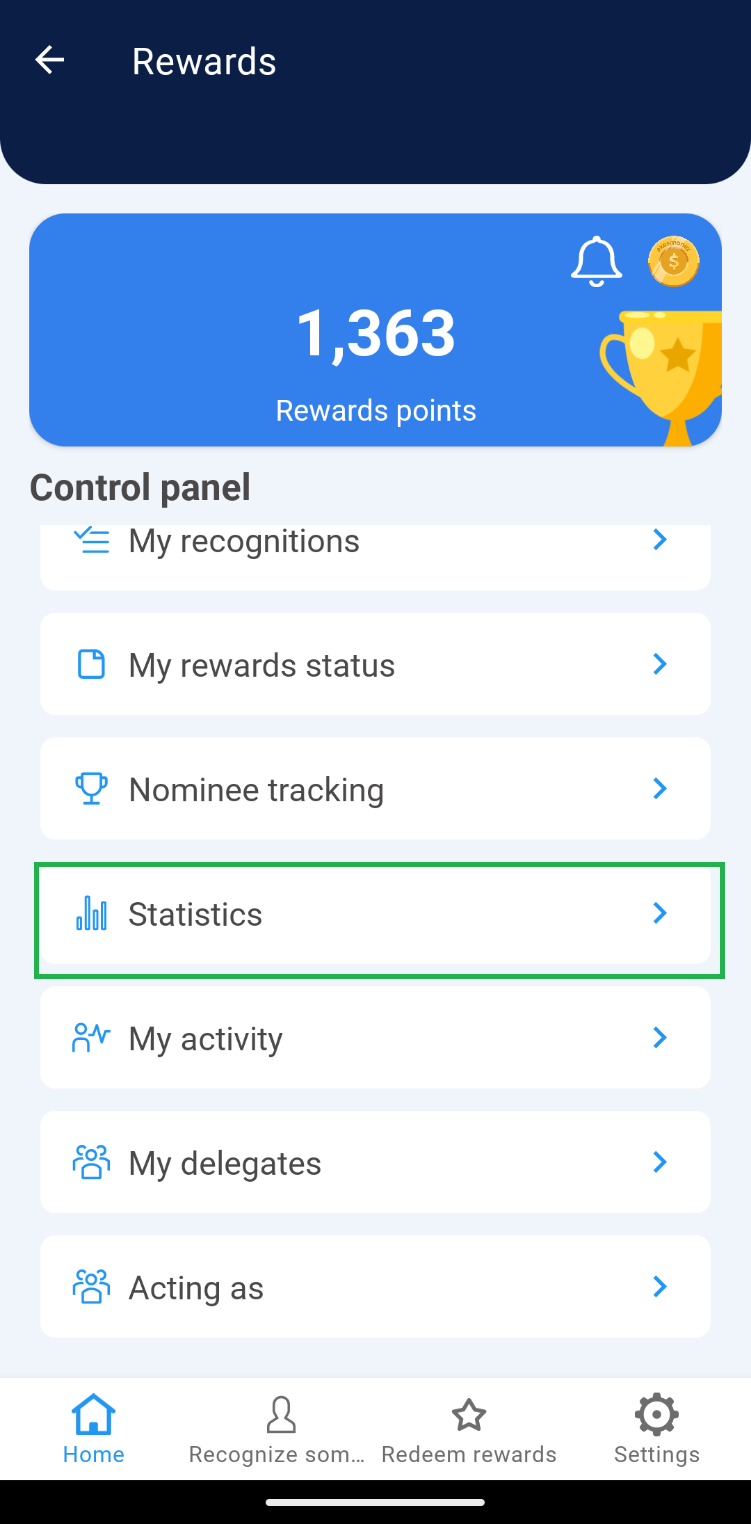
1. Go to “Statistics”.
2. The “Recognized” section is displayed by default in the horizontal menu, check that it is selected.
Note: If the user is the leader of 2 or more teams, the leader can select the corresponding team from the menu shown at the top.
3. In the “Recognized” section you can identify the following elements:
a) Unrecognized users in two periods: Select the avatar of any user to see the details of each one.
b) Two-period graphs: These graphs show the number of employees who have been active in two periods (quarters), whether recognized or unrecognized.
c) List of users: Through the icon (i) you will be able to see the name of the users that are part of the chart as recognized or unrecognized.
Use of Rewards
1. Go to “Statistics”.
2. In the horizontal menu select the “Use of Rewards” section.
Nota: If the user is the leader of 2 or more teams, the leader can select the corresponding team from the menu shown at the top.
3. In the ” Use of Rewards” section in the horizontal menu, select the period (Q1, Q2, Q3, Q4) you wish to see, where you will be able to identify the following elements:
a) Periods: These are 3-month groupings that show the list of employees (and their team) and the number of people recognized.
b) Team member who received the most recognitions: Highlights the team member who received the most recognitions in that period.
Recognition between areas
1. Go to “Statistics”.
2. In the horizontal menu select the section “Recognition between areas”.
Nota: If the user is the leader of 2 or more teams, the leader can select the corresponding team from the menu shown at the top.
3. In the “Recognition between areas” section in the horizontal menu, select the period (Q1, Q2, Q3, Q4) you wish to see, where you will be able to identify the following elements:
a) Received: Shows a graph with the recognitions received by other teams.
b)Awarded: Shows a graph with the recognitions given to other teams.