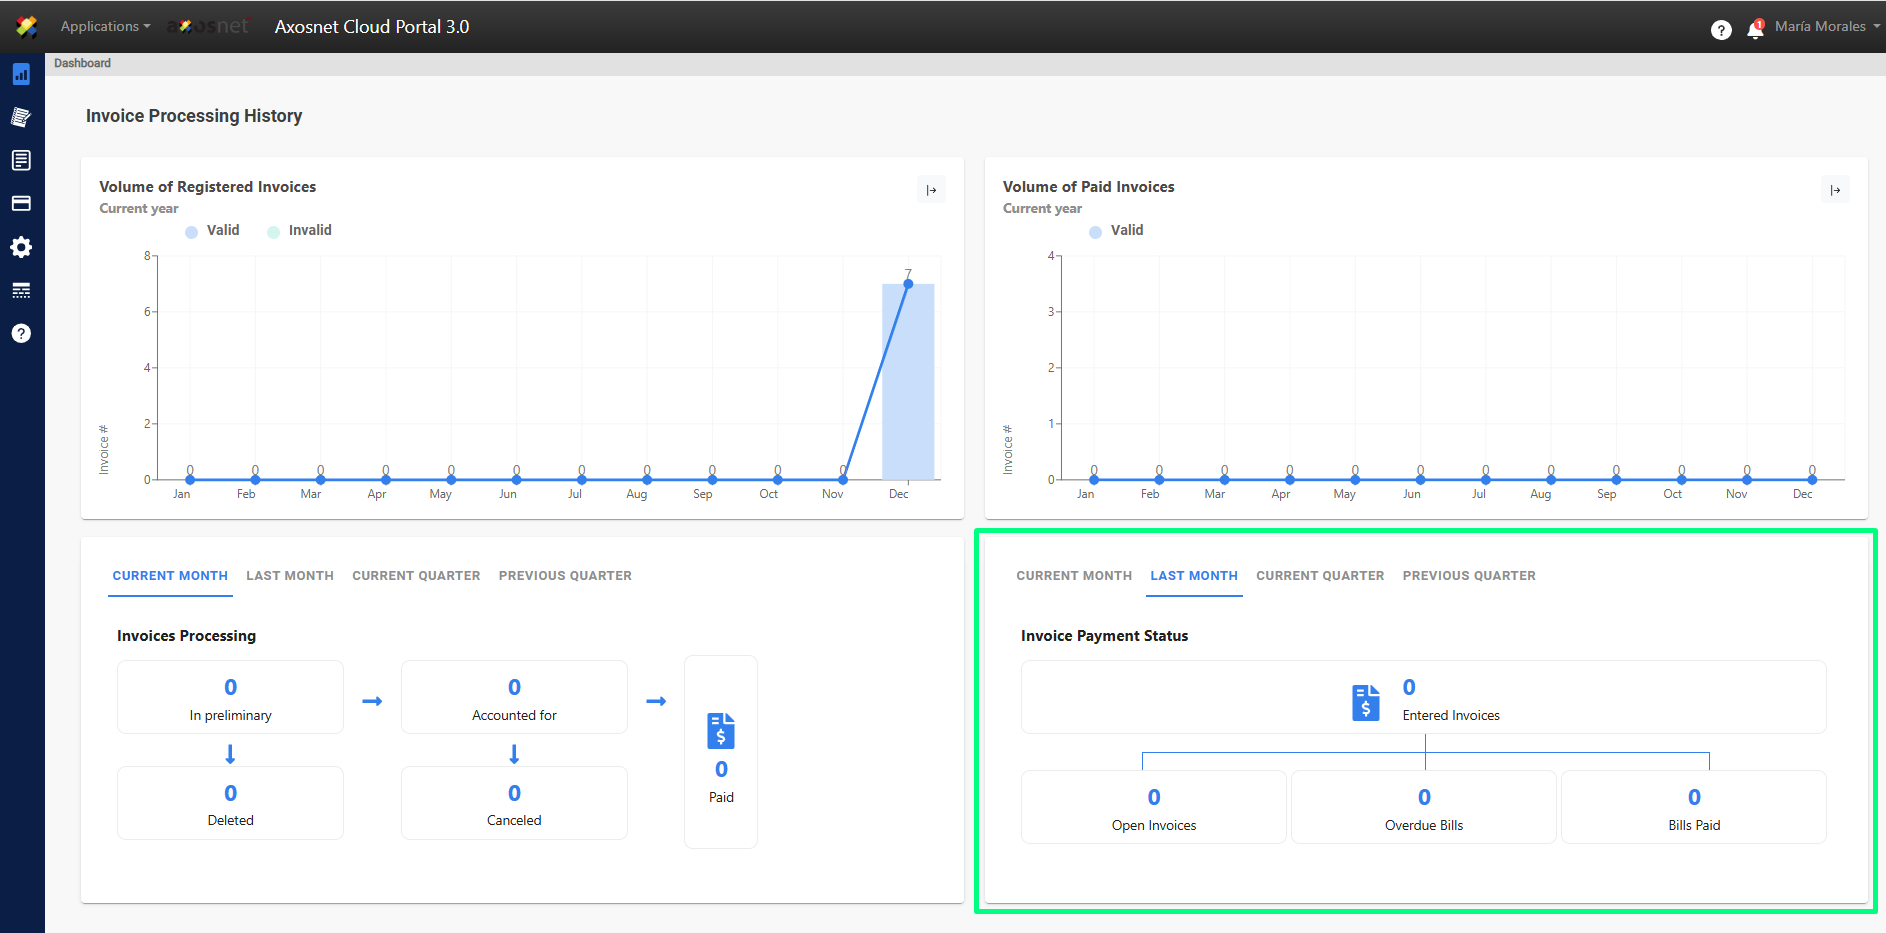
In ACP 3 we have the main screen or Dashboard that allows us to observe a series of invoice statuses from 2 sources (Portal and ERP) and dispersed in 4 graphs.
Depending on the status in the Portal, it allows us to see the (i) Volume of Registered Invoices and (ii) Volume of Paid Invoices. And through the status in the ERP, it allows us to see (iii) Invoice Processing and (iv) Invoice Payment Status.
This information can be displayed by current month and months prior to the current year. By clicking on the cards that are within the Invoice Processing and Invoice Payment Status graphs, a list of the corresponding invoices will be shown.
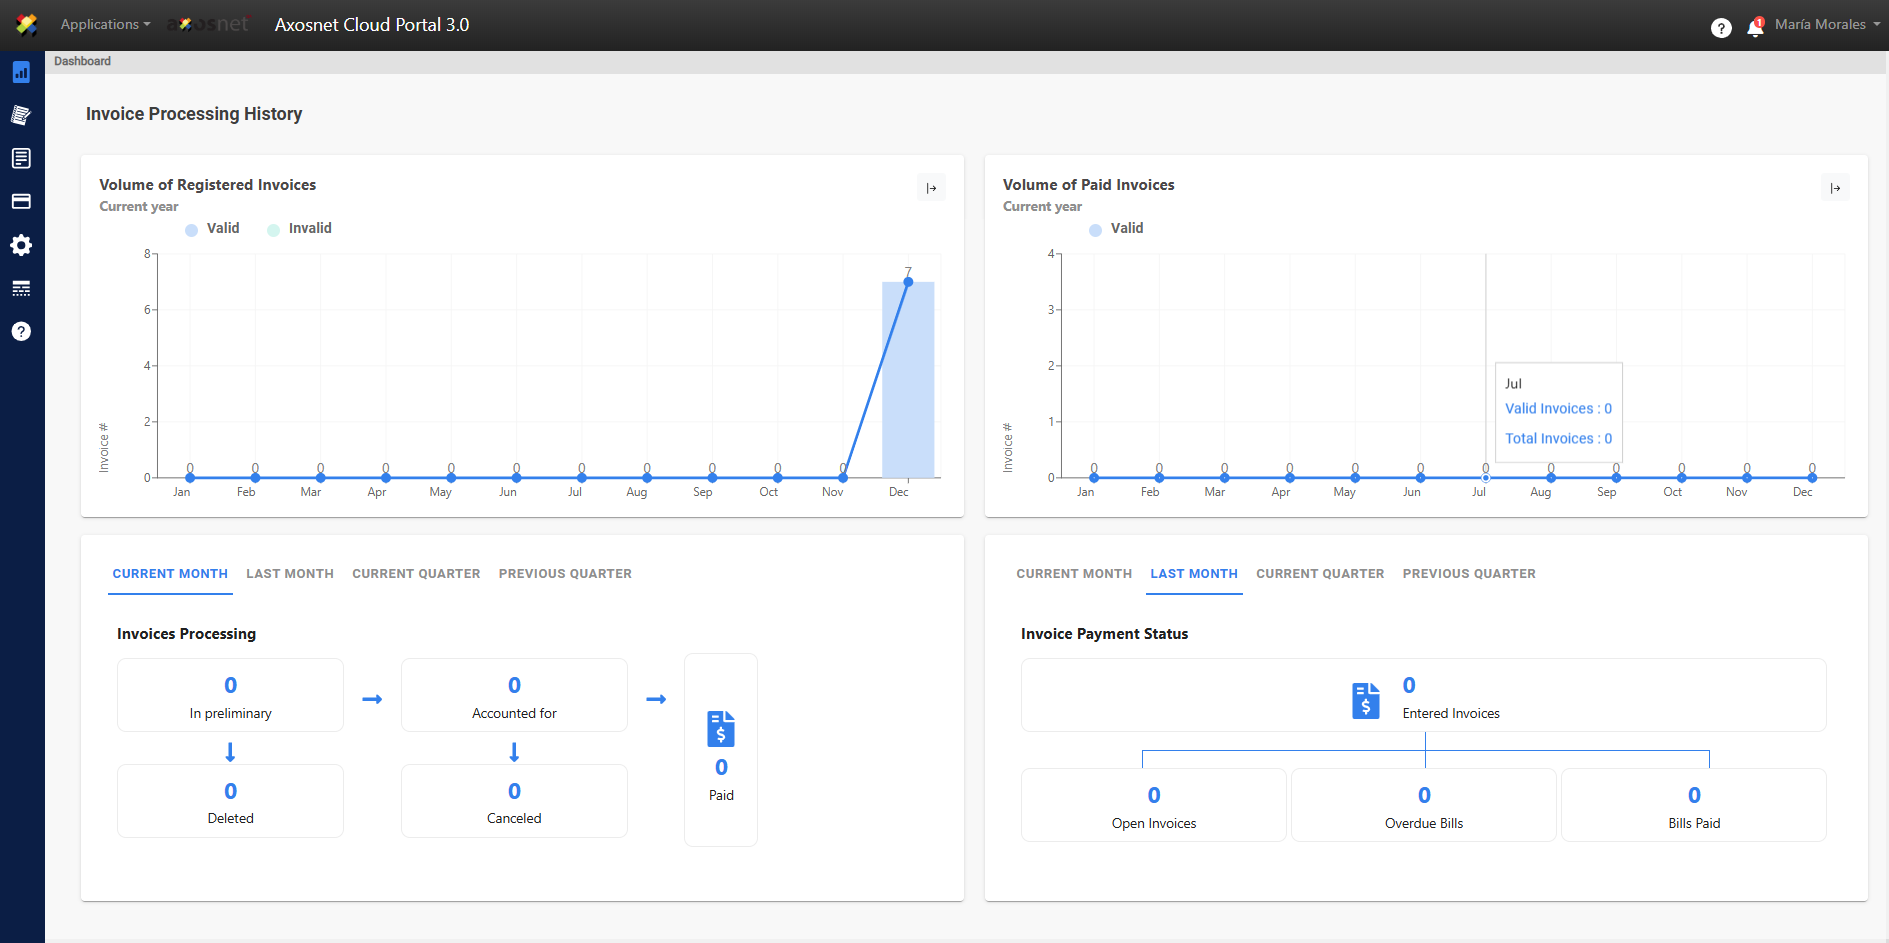
Page Structure
The Dashboard shows us 4 Charts divided into two sources, portal status and ERP status, where we can see the following information:
- Portal Status
- Volume of Registered Invoices: Valid Invoices, Invalid Invoices, etc.
- Volume of Paid Invoices: Valid Invoices
- ERP Status
- Invoice Processing:
- Preliminary, Deleted, Canceled, Accounted, Paid, etc.
- Invoice Payment Status
- Invoices Entered: Open, Overdue, Paid, etc.
- Invoice Processing:
Menu Panel
On the left side we will find a side menu that is displayed when we move the cursor over it. In this menu we can see the following options:
- Dashboard
- Purchases
- Invoices
- Payments
- Settings
- Master Log
- Documentation
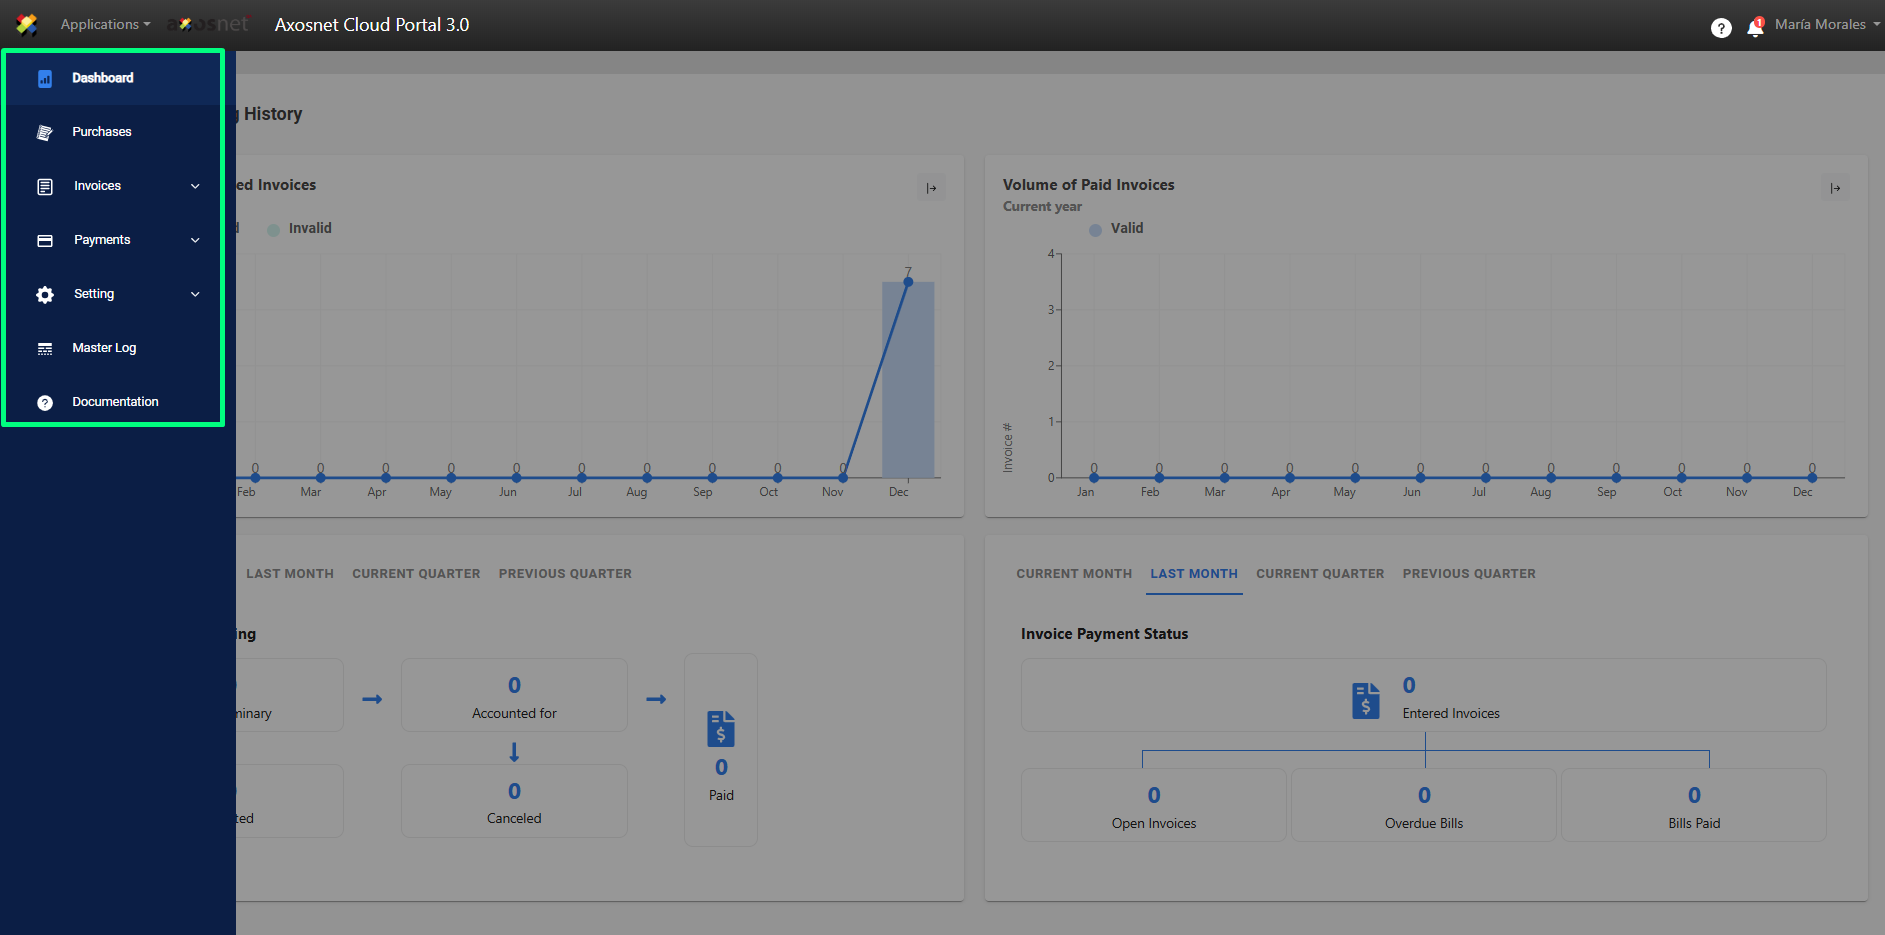
Note: The menu options may change depending on the role that the user has at the time of logging in.
Dashboards
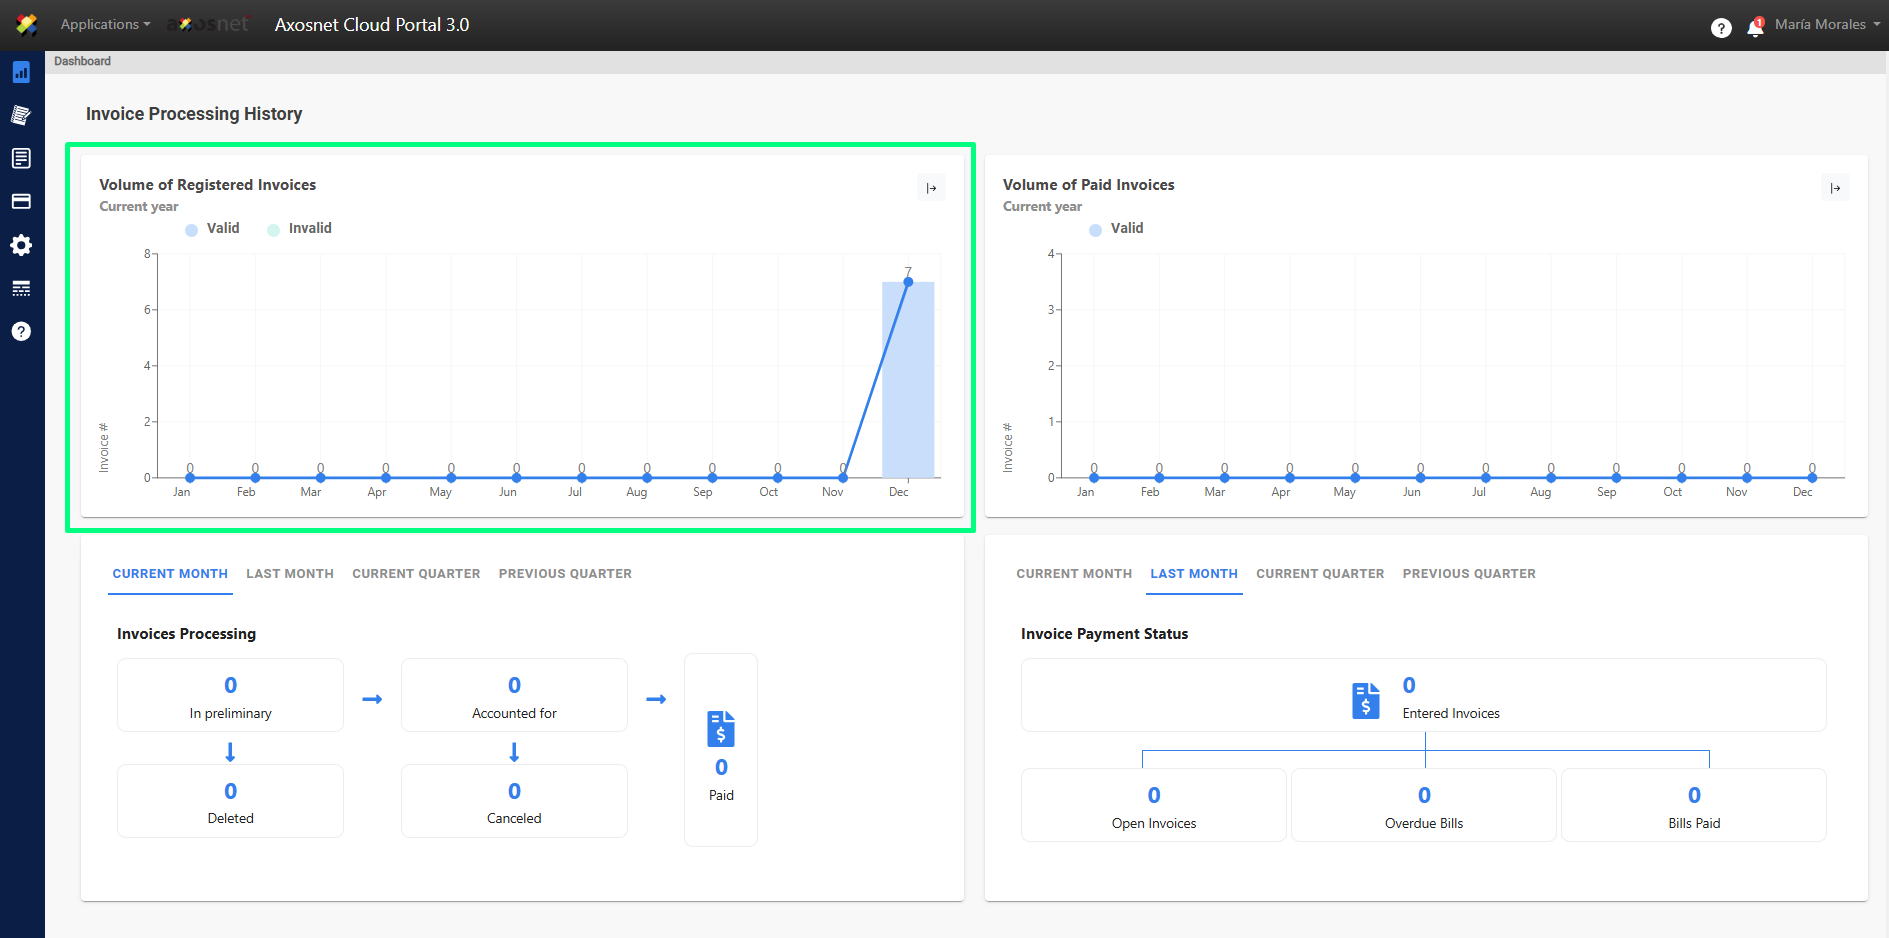
Dashboard 1: Volume of Registered Invoices
The first graph that is shown is the Volume of Registered Invoices, in this we can see the number of valid and invalid invoices that have been registered in the current year.
Note: The graph can be extended if we click on the icon with the arrow in the upper right.
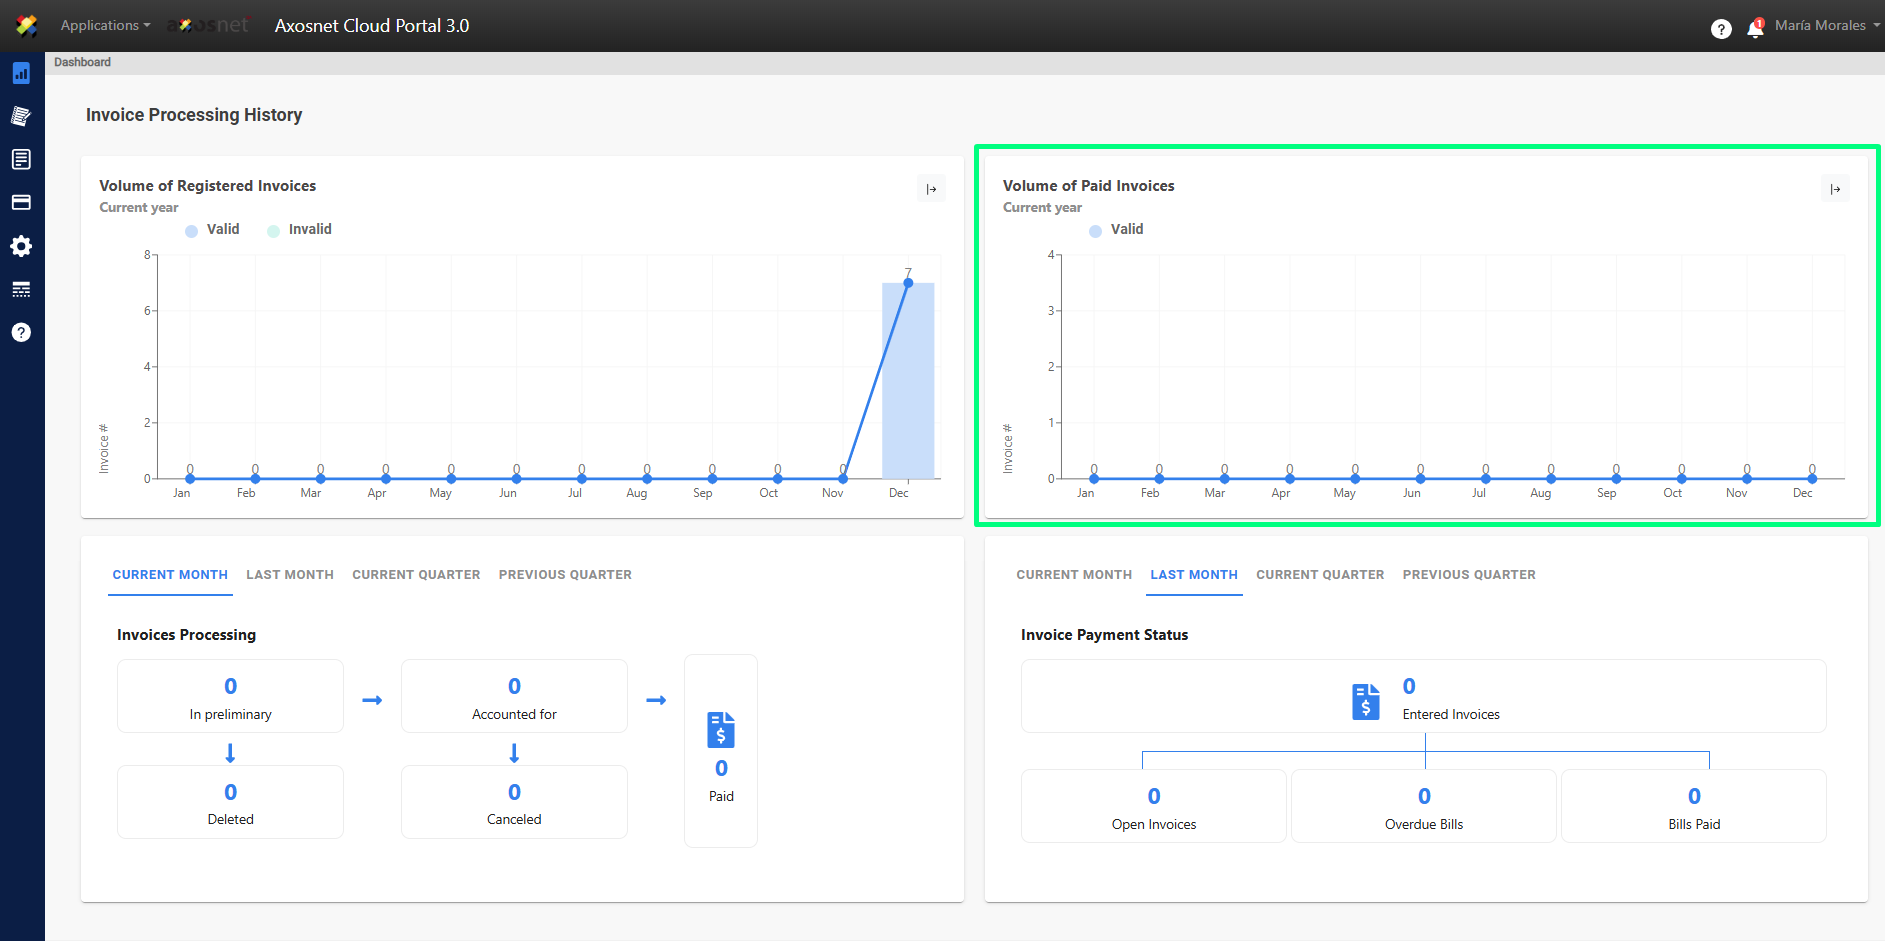
Dashboard 2: Volume of Paid Invoices
The second graph that is shown is the Volume of Paid Invoices, in this we can see the number of valid invoices that have already been paid in the current year.
Note: The graph can be expanded by clicking on the icon with the arrow at the top right.
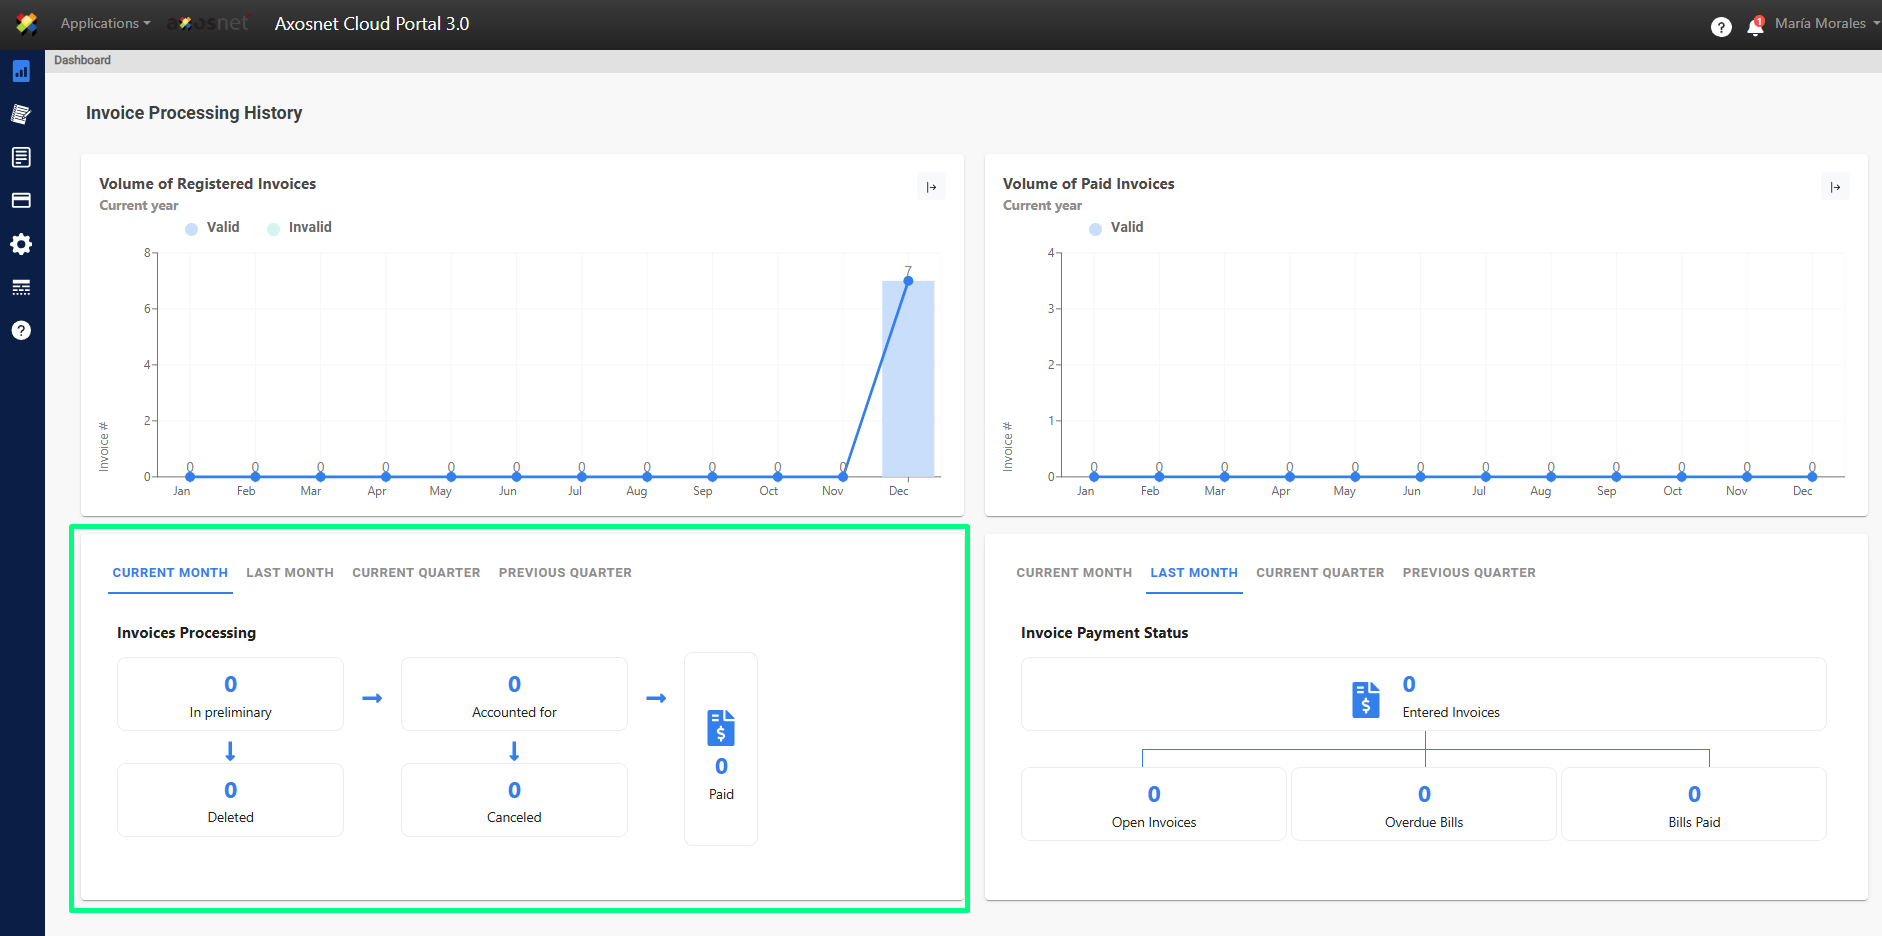
Dashboard 3: Invoices Processing
The third graph shown is the Invoice Processing graph, in which we can see the number of invoices with various statuses such as Preliminary, Deleted, Cancelled, Accounted for and Paid. We also have the option to view invoices for the current month, the previous month, the current quarter and the previous quarter of the current year.
Dashboard 4: Invoice Payment Status
The fourth graph shown is the Invoice Payment Status graph, in which we can see the number of invoices entered that have been opened, have expired and have been paid. We also have the option to view invoices for the current month, the previous month, the current quarter and the previous quarter of the current year.
